When you decide to develop web applications, you must take care of a few things for producing a smooth end product. A good developer always opts for best practices while developing robust apps. These practices include testing, debugging, performance, and security of websites or applications. In the previous article, I had covered a few topics from the above. In this article, I’ll discuss PHP debug concepts and techniques in PHP code.
Let’s start with the basic level, where you tend to write PHP code using print_r(), var_dump() commands to debug the output of the written code. These functions show you the correct output or errors/warnings in case of code failure. Although this PHP debugging technique is basic, it is still in use.
Error Logs in PHP
When you are working in the dev environment on any web hosting for PHP, error reporting must be on so that you can have a quick look in browser what error logs in PHP are generating. You can enable/disable error logs from the php.ini file and individual php files. The other best practice is to always create a configuration file in your project.
In the php.ini file, you can enable it easily. Do remember that you must remove; from each starting line.
error_reporting = E_ALL & ~E_NOTICE
error_reporting = E_ALL & ~E_NOTICE | E_STRICT
error_reporting = E_COMPILE_ERROR|E_RECOVERABLE_ERROR|E_ER… _ERROR
error_reporting = E_ALL & ~E_NOTICE
To enable PHP error logging for the current call in the individual file, you can write the following code on the top:
ini_set('display_errors', 1);
ini_set('display_startup_errors', 1);
error_reporting(E_ALL);
But still, you need to enable this line in the php.ini file for reporting parse errors:
display_errors = on
The above techniques are useful in any environment. But, if you have finally completed your app and are uploading to production servers, you might forget to revert the dev settings. In this case, you can create a configuration file that includes the conditions in which you display and log errors. You can write the following code for error checking in PHP:
define('DEBUG', true);
error_reporting(E_ALL);
if(DEBUG == true)
{
       display_errors(true);
       log_errors(false);
}
else
{
      display_errors(false);
       log_errors(true);
}
You can define env in the above method and can set your required conditions. Like, if you don’t want to log errors but just want to display them in the browser, you can define env in the above method for that.
Here are the different methods for error checking in PHP that you can use to debug php scripts, errors, and warnings.
// Turn off all error reporting
error_reporting(0);
// Report simple running errors
error_reporting(E_ERROR | E_WARNING | E_PARSE);
// Reporting E_NOTICE can be good too (to report uninitialized
// variables or catch variable name misspellings ...)
error_reporting(E_ERROR | E_WARNING | E_PARSE | E_NOTICE);
// Report all errors except E_NOTICE
error_reporting(E_ALL & ~E_NOTICE);
// Report all PHP errors (see changelog)
error_reporting(E_ALL);
// Report all PHP errors
error_reporting(-1);
// Same as error_reporting(E_ALL);
ini_set('error_reporting', E_ALL);
PHP Debug Driven Development? What is this?
At the time of writing this article, I’m not sure if the debug driven development (DDD) term is right, but I got this idea from my friend who is always busy debugging his code during the development phase. I have seen his code that contains multiple breakpoints and he roams through each line response till he gets the desired output :D. Don’t be confused about breakpoints. I’ll show you what are they. I thought this is a similar concept to TDD where you first write the test case and then code to pass this test. DDD can have a similar flow where you will first define all the PHP debugging techniques for configuration, and then write the code to debug if any errors come up.
At this point, it is fair enough to introduce Xdebug to you all. It helps you understand the concept of PHP debugs driven development. When you run PHP with Xdebug, it gives you full insights into errors, responses, and code coverage.
What Exactly Xdebug is?
Imagine you have already written the code and now you are about to compile it. Bump! Something goes wrong and the code breaks. And worst still that you can’t identify what’s that. Xdebug is your savior here. Xdebug is an extension of PHP which helps developers in debugging and smooth development of their projects to carefully watch for errors and solve them. It upgrades PHP’s var_dump() function. It also adds stack traces for Notices, Warnings, Errors, and Exceptions.
Xdebug allows us to add breakpoints and stop the code execution at every breakpoint so that you can see variables output in only one iteration of code. Thus, saving your precious time which will be otherwise lost in code debugging. Without Xdebug, you must refresh the page to see the output again.
You can also set breakpoints independent methods to see which one is causing issues. Also, you can add as many breakpoints as you want in the code, and then use PHP debugger to check each code line by line.
Install Xdebug in PHP
Now it’s time to install Xdebug in PHP. There are a few options through which you can install Xdebug.
Windows:
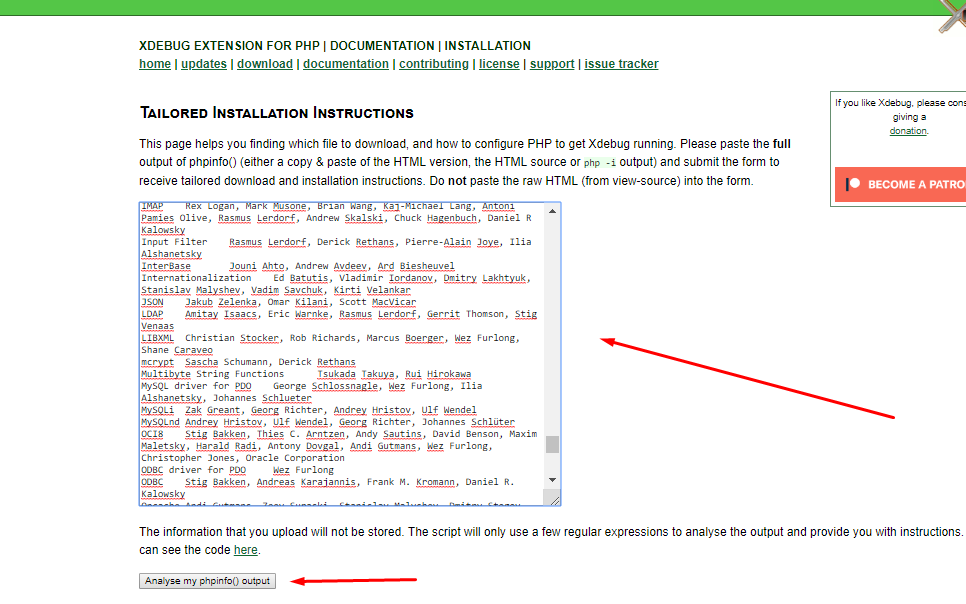
For windows users, Xdebug is providing a wizard tool through which you can download the related .dll file. For this, first, create a PHP file in folder, and add the following line of code:
<?php
phpinfo();
?>
Run the file in the browser. You will see the PHP information. Copy the details and put them in the wizard tool and click on Analyze my phpinfo() output button.
This will give you the following output: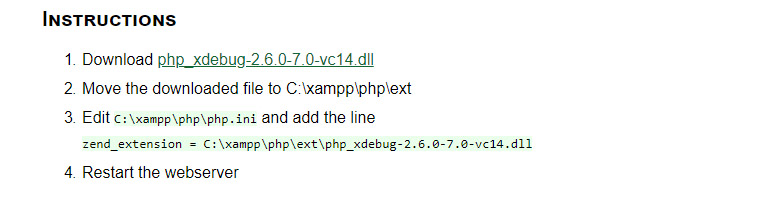
Now, download the .dll files and follow the above-mentioned instructions to put files in the xampp/php/ext directory. Next, follow step 3 to enable Xdebug in the php.ini file, and finally restart the webserver.
MAC
You can install PHP7 Xdebug using pecl extension:
pecl install xdebug
Linux
On Linux distribution like Debian, you can use Sudo to install Xdebug in PHP:
sudo apt install php-xdebug;
Now, open the file etc/php/7.0/mods-available/xdebug.ini and add the following code to enable Xdebug:
xdebug.profiler_enable_trigger = 1
xdebug.profiler_enable = 0
xdebug.remote_enable = 1
xdebug.profiler_output_dir = "/tmp"
Now, restart the Apache2 server.
sudo service apache2 restart;
Windows
Due to Windows’ tendency to make stuff more complicated, installing Xdebug will require many steps.
Note: Since we’ll be modifying just the php.ini file, it doesn’t matter if you are using Apache, Nginx, Xampp, etc.
The first step is to identify your current version of PHP, for which you can create a new PHP file, put a phpinfo(), and then search for the following lines (use Ctrl+F).
– Version: Right at the start of the info page.– Compiler: Take note of the compiler version (VC11, VC14, etc.)– Architecture: It will tell you if you are using x86 (32 bits) or x64 (64 bits).– Thread Safety: check if you have it enabled or not. If it is enabled, then your version is “Thread Safe” (TS), otherwise, it’s “Non-Thread Safe” (NTS). More info here.
Having this info, you should go to the download page for Xdebug and choose the right version for your current setup. The DLL you’ll get must be put in your PHP extensions folder, i.e. C:\xampp\php\ext.
Registering Xdebug on PHP
After Xdebug is downloaded and installed, you’ll have to register and enable the extension in your php.ini. For this, open the file and at the end add the following lines:
[xdebug]
; Path for the library in the extensions folder
zend_extension="/path/to/xdebug"

; Enable communications using DBGp protocol
xdebug.remote_enable=1

; Automatically start a debugging session?
xdebug.remote_autostart=1

; Host on which the IDE will run. Useful when using Docker
xdebug.remote_host=127.0.0.1

; The port to use for DBGp. Default is 9000
xdebug.remote_port=9000

; Show stacktraces?
xdebug.default_enable=1
GIT
You can also clone it from GitHub.
git clone git://github.com/xdebug/xdebug.git
After installing Xdebug, open the php.ini file, and enable the extension.
zend_extension="xdebug.so"
Now, check the PHP version using the command `php -v`. You will see the Xdebug version installed with PHP.
$ php -v
PHP 7.2.0RC6 (cli) (built: Nov 23 2017 10:30:56) ( NTS DEBUG )
Copyright (c) 1997-2017 The PHP Group
Zend Engine v3.2.0-dev, Copyright (c) 1998-2017 Zend Technologies
 with Xdebug v2.6.0-dev, Copyright (c) 2002-2017, by Derick Rethans
Configure Xdebug in VSCode
If you want a smooth workflow with Xdebug, you can integrate it into your favorite IDE like phpstorm, Zend studio, and VScode. Let’s configure Xdebug in Visual Studio Code to debug PHP.
There is a popular VSCode PHP extension called php debug. You can find it in the extension window and install it.
After installation, you must reload the VSCode window. Now, again run phpinfo(); method in any PHP file to check if Xdebug is enabled or not.
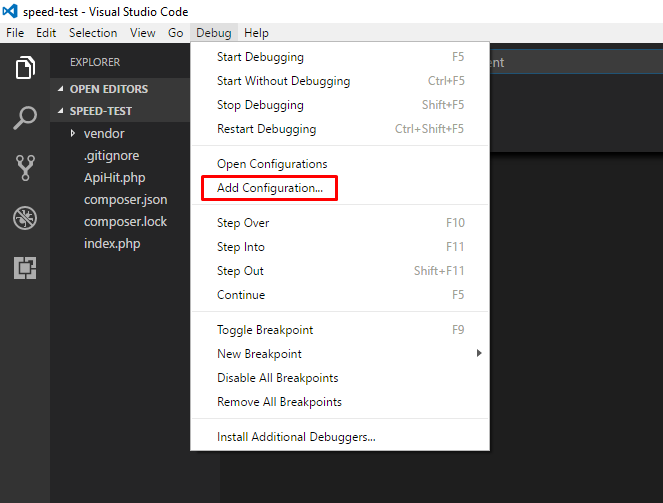
Now click on the debug console tab and click on add configuration.
 Now, you must select the environment which is PHP. VSCode will now add a launch.json file in the root directory.
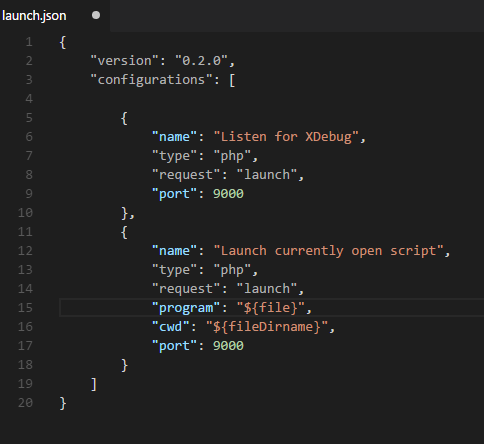
Finally, add the runtimeExecutable property to the list after port:
"runtimeExecutable": "C:\\xampp\\php\\php.exe"
Save the launch.json file. Open the debug mode tab, and click on the green debug button to start the debugging option.
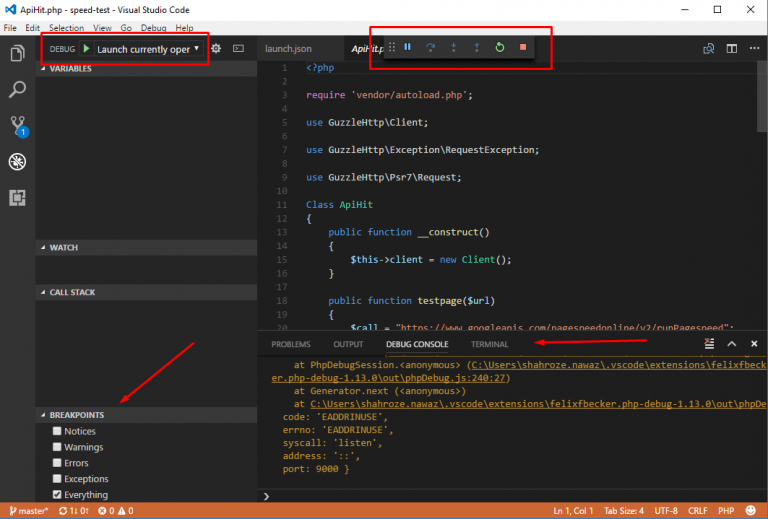 You will now see few items in the window, through which you can select what logs Xdebugger will show like:
Notices
Warnings
Errors
Exceptions
Everything
You will now see few items in the window, through which you can select what logs Xdebugger will show like:
Notices
Warnings
Errors
Exceptions
Everything
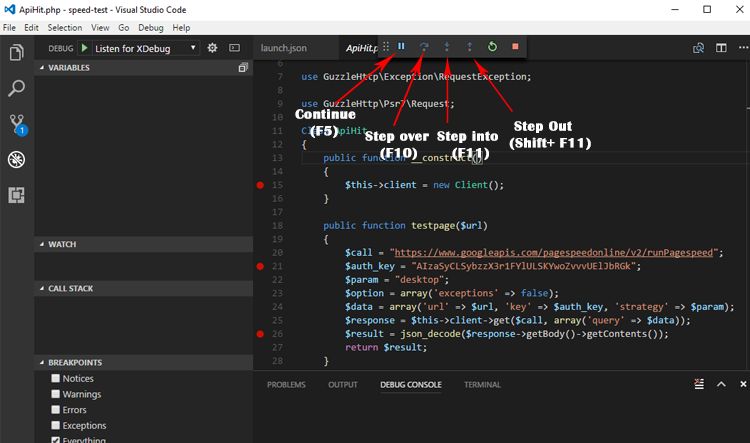
Navigate to the Debug Console section which shows you the details of errors and the debug execution buttons on top.
You can select as per your choice. Now let me tell you the thing which I have already discussed in the early stage breakpoints. At this point, you can add breakpoints on the lines of code that you need to debug. Note that Xdebug will add the PHP debug script name with the line number on the bottom left section:
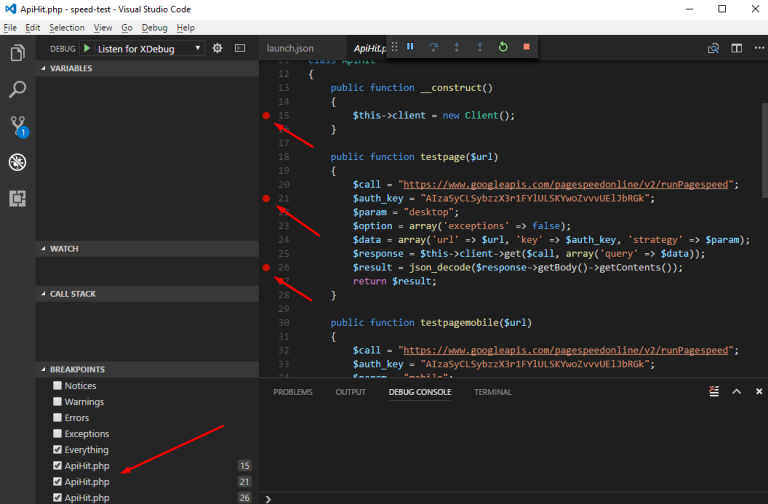
You can run the application in the browser, and then read the code line by line, to see the errors and debug them properly. Also, you need to remind a few shortcut functions keys to move through functions and line of codes:
F5: Continue Debugging
F10: Step Over
F11: Step into
Shift + F11: Step out
Xdebug Profiling
Xdebug also provides profiling of code just like other profiling tools, Blackfire and Tideways. If you want to use the profiling option, then you must enable it in the php.ini file.
xdebug.profiler_enable=1
xdebug.profiler_output_dir="C:\xampp\tmp"
Now, open a file and start entering all the profiling logs.
PHP debugging Tools
Since PHP is a popular language, it offers several tools to work with different IDE and code editors. For debugging purposes, you can find the following tools: Firephp Sublime PHPstorm Netbeans Zend studio Kint Webgrind PHP_Dyn PHP debug Bar
It’s not easy to decide which PHP debugger tool you should choose for checking error logs, because you must have basic knowledge about the tool’s functionality. As I’ve already discussed the integration of Visual Studio Code to debug PHP, you can use it to your advantage.
Frequently Asked Questions
Q: How to debug PHP in Chrome?
A: You can easily debug PHP in Chrome using a simple extension called PHP Console. Just install this PHP debugging tool from the Chrome web store and start logging errors, warnings, exceptions, and vars dump on your Chrome browser.
Q: How to debug PHP in Firefox?
A: To easily debug PHP applications in Firefox, you can use the PHP debugger extension named Xdebug Helper for Firefox. This Xdebug PHP extension helps developers in profiling and tracing PHP codes fast on Mozilla Firefox. It also helps you to enable/disable debugging easily instead of tedious POST/GET variables & cookies.
Q: How to disable Xdebug in PHP?
A: To disable Xdebug in PHP, go to your php.ini file and find an entry with Xdebug. Comment it out by putting “;” to the extension as: ; zend_extension = “/path/to/php_xdebug.dll” Restart your apache server and you will see Xdebug disabled in the next stage.
Q: How to resolve PHP debugger not installed error?
A: To resolve this error, check the file in your C:/php/ext/ directory, which may contain some missing or wrong extension.
Follow these five steps to resolve this error: Go to xDebug Download Xdebug 2.4.0rc1 Rename it to php_xdebug.dll Paste this file in “php/ext” folder Restart your server.
Q: What are the PHP debugging tools for Firefox?
A: You can debug PHP code in Firefox using multiple debugging tools. Firefox provides an extension for popular PHP debugging tools including FirePHP, Xdebug, Firebug, and others.
Final Words
Debugging is always an important aspect of coding. Without it, you can not see what is going wrong with the code. It’s a good practice to set up your debugging environment before writing the code, because, if you are developing a complex application which contains thousands of lines of code, you will need a PHP debugger that finds errors and warning signs quickly.
In this article, you have learned how to enable PHP to debug with Xdebug and configure it in VSCode. You can also integrate it in Eclipse, PHPstorm, and other IDEs. If there is anything you want to know more about, do post your comments and suggestions in the comments section below.
ISSUESI had issues when making it work with VsCode on Windows. the problem was that dll file that Xdebug site recommended didn’t work for some reason on my wamp.
Xdebug site recommende me this file: php_xdebug-3.0.0-7.3-vc15-x86_64.dllbut then I used an old version like this : php_xdebug-2.7.2-7.3-vc15-x86_64.dll
and it worked fine. here my configurations.
for php.ini
[xdebug]
zend_extension="c:/wamp64/bin/php/php7.3.5/zend_ext/php_xdebug-2.7.2-7.3-vc15-x86_64.dll"
xdebug.remote_enable = 1
xdebug.remote_autostart = 1
xdebug.default_enable=1
xdebug.remote_log = "C:/wamp64/tmp/xdebug.log"
xdebug.trace_output_dir = "C:/wamp64/tmp"
xdebug.remote_cookie_expire_time = 36000
For my VsCode
{
    // Use IntelliSense to learn about possible attributes.
    // Hover to view descriptions of existing attributes.
    // For more information, visit: https://go.microsoft.com/fwlink/?linkid=830387
    "version": "0.2.0",
    "configurations": [


        {
            "name": "Listen for XDebug",
            "type": "php",
            "request": "launch",
            "log":true,
            "port": 9000,
            "pathMappings": {
                "E:/www-2017/duplicated-site6/public": "${workspaceFolder}",  //localhost/test
            }

        },
        {
            "name": "Launch currently open script",
            "type": "php",
            "request": "launch",
            "program": "${file}",
            "cwd": "${fileDirname}",
            "port": 9000,
            "log":true
        }
    ]
}
If we want to debug in the cli mode, we have to configure xdebug in the /etc/php/7.2/cli/php.ini. Previously, I just set /etc/php/7.2/fpm/php.ini!
This is my setting in the /etc/php/7.2/cli/php.ini:
[XDebug]
xdebug.remote_enable = On
xdebug.remote_autostart = On
Here a video tutorial explaining more features: